Fusedash
Fusedash turns raw data into interactive dashboards and reports, delivering quick insights for informed decision-making.
Visit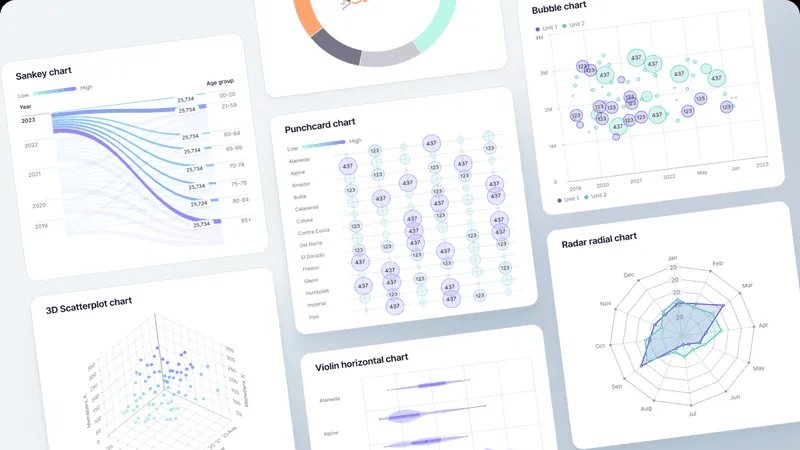
Fusedash is a cutting-edge AI data visualization platform that empowers teams to convert raw data into visually engaging and actionable dashboards, charts, maps, and narrative reports. Designed for organizations looking to enhance their data analysis processes, Fusedash alleviates the complexities associated with using multiple tools by providing a single platform for all data visualization needs. With an emphasis on reusability, users can maintain consistent Key Performance Indicator (KPI) definitions across various views, ensuring clarity in data interpretation. This functionality allows for effective filtering by segments, regions, products, or timeframes, enabling teams to drill down into the data to identify changes and their causes. Incorporating AI-driven features for natural language queries, quick summaries, and visualization support, Fusedash facilitates real-time monitoring of critical metrics, making it an essential tool for KPI reviews, performance tracking, operations monitoring, and geographic analysis. Organizations can streamline their workflows, reduce the time spent on report generation, and focus on deriving insights to drive informed decision-making.
Features of Fusedash
Flexible Views
Fusedash provides the ability to create tailored dashboards, charts, maps, and report-style views from the same dataset. This flexibility ensures that different stakeholders receive the specific insights they need without unnecessary back-and-forth communication. Users can customize layouts, apply filters, and set time ranges, allowing for a personalized presentation that serves distinct audiences efficiently.
AI Chart Generator
The AI Chart Generator within Fusedash allows users to create visually appealing charts from CSVs or APIs in a matter of minutes. By selecting the appropriate chart types, adding comparisons, and refining labels, users can ensure that charts effectively convey their intended narratives. These charts can be integrated into dashboards or utilized as standalone visuals for various reporting needs.
Dashboard Software
Fusedash combines dashboards and narrative reporting in one cohesive workspace, allowing teams to monitor KPIs while providing essential context. The integration of storytelling features enhances the clarity of reports by explaining what has changed, why it matters, and outlining next steps. This ensures all team members remain aligned and reduces discrepancies across different report versions.
Data Integrations
Fusedash simplifies data management by allowing users to combine CSVs, APIs, and public data into a unified platform. Users can upload datasets, connect to APIs, and enrich their views with relevant public data, which is particularly beneficial for location or market context. This capability keeps datasets organized and reusable across various charts, dashboards, and reports.
Use Cases of Fusedash
Real-Time Performance Monitoring
Fusedash can be utilized by teams to monitor key performance metrics in real-time, providing immediate insights into business operations. This feature is crucial for timely decision-making and allows stakeholders to react swiftly to any fluctuations in performance.
Comprehensive KPI Reviews
Organizations can leverage Fusedash for in-depth KPI reviews, ensuring that all team members are on the same page regarding performance metrics. The platform's ability to maintain consistent definitions and visualizations aids in building a unified understanding of business health across departments.
Data Storytelling for Presentations
Fusedash's storytelling capabilities enable users to create compelling narratives around their data, making it easier to communicate insights during presentations. This feature is particularly valuable for leadership teams who need to convey complex information in an accessible manner and drive strategic discussions.
Cross-Departmental Collaboration
With the ability to create customized views for different departments, Fusedash fosters collaboration among teams. It allows diverse groups to access relevant data visualizations tailored to their specific needs, thereby enhancing cross-functional communication and reducing redundancy in reporting efforts.
Frequently Asked Questions
What types of data can I upload to Fusedash?
Fusedash allows users to upload CSV files and connect to various APIs. This flexibility ensures that users can integrate diverse data sources into their dashboards and reports, enhancing the richness of their analyses.
Can I customize the dashboards for different stakeholders?
Yes, Fusedash offers extensive customization options for dashboards, allowing users to tailor layouts, filters, and time ranges. This ensures that each stakeholder sees the insights that matter most to them without unnecessary confusion.
How does the AI Chat feature work?
The AI Chat feature enables users to pose questions in plain language about their data, receive suggestions for relevant metrics and visualizations, and create shareable views. This functionality accelerates data exploration and enhances user experience.
Is there a way to ensure consistency in KPI definitions across reports?
Fusedash allows users to define KPIs and dimensions that can be reused across all dashboards, charts, and reports. This standardization is essential for maintaining consistency and trust in the results presented to different teams.
You may also like:
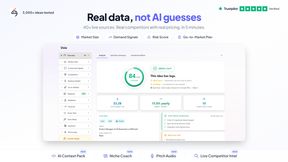
Preuve AI
Preuve AI scans 50+ live data sources in 60 seconds to validate your startup idea with real proof and a viability score.
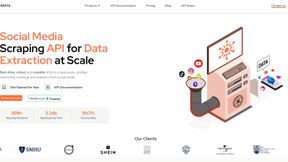
EnsembleData
EnsembleData provides real-time social media scraping APIs to automate extraction of posts, profiles, and analytics at scale.
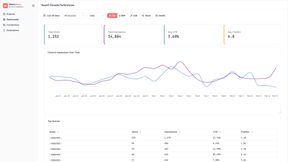
Metric Nexus
Metric Nexus centralizes your marketing data for seamless querying with AI, enabling instant insights without complex setups.
Boost Your Growth
Submit your SaaS to 140+ directories and SaaS submission sites. We handle every listing so you can focus on building your product.