LoadTester
LoadTester automates HTTP and API load testing from your browser or CI/CD pipeline with live analytics and zero infrastructure.
Visit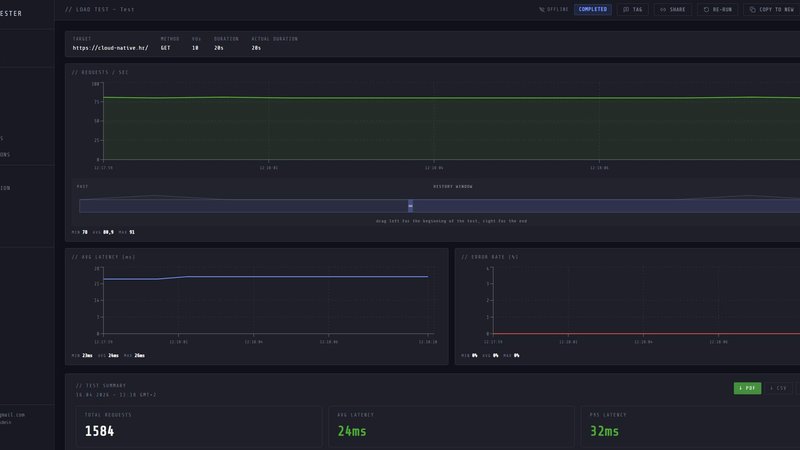
LoadTester is a modern, cloud-native HTTP and API load testing tool built by Cloud Native d.o.o. for engineering teams that need fast, repeatable, and infrastructure-free performance checks. It eliminates the traditional overhead of setting up, configuring, and managing load testing infrastructure, allowing developers and QA engineers to focus entirely on application performance and reliability. With LoadTester, you can create a test scenario, choose between virtual users or requests per second, and launch distributed load tests directly from your browser or CI/CD pipeline. The platform provides live analytics during the run, including throughput, latency distributions (p50, p95, p99), error rates, and active virtual users, all updating in real time. After the test completes, you receive a clean, actionable summary with total requests, average latency, data sent and received, and shareable exports in PDF, CSV, or JSON formats. LoadTester supports scheduled baseline tests, run-to-run comparisons, and automated threshold-based stopping to catch performance regressions before they impact end users. It also offers API access, webhooks, Slack and email alerts, and seamless workflow integrations for teams that want simple, repeatable performance checks embedded in their development lifecycle. The free plan is available, and the platform scales from small team experiments to enterprise-grade distributed testing with up to 10,000 virtual users and 10,000 requests per second, all with a cold start time under three seconds.
Features of LoadTester
Instant Distributed Execution
Start distributed load tests in seconds without any infrastructure setup, worker orchestration, or scheduling headaches. LoadTester automatically dispatches workers and scales them based on your test configuration, so your team focuses on results and performance analysis rather than managing servers. The cold start to first request takes under three seconds, and the queue time is effectively zero, meaning you can launch a test and start seeing live data almost immediately.
Live Analytics and Telemetry
Watch requests, latency, failures, throughput, and bottlenecks in real time while your test is running. The live dashboard updates every second with key metrics including requests per second (RPS), p50, p95, and p99 latency, active virtual users, and error counts. A latency distribution chart shows trends over the last 60 seconds, helping you spot performance degradation as it happens. This immediate feedback loop allows you to make on-the-fly adjustments or stop tests early if thresholds are breached.
Smart Auto-Stop with Thresholds
Set failure or latency thresholds and automatically stop tests when things go sideways. LoadTester supports multiple guardrails including p95 latency limits, error rate caps, and regression alerts compared to previous baselines. When a threshold is breached, the test can auto-stop to prevent wasted resources or further impact, and notifications can be sent via Slack, email, or webhook. This feature is essential for CI/CD pipelines where you need automated pass/fail decisions without manual intervention.
CI/CD Ready and Workflow Integrations
Run tests on every deploy, schedule nightly baselines, and integrate performance checks directly into your development workflow. LoadTester provides API access for programmatic test creation and execution, webhooks for triggering actions on completion, and native integrations with Slack and email for alerts. Scheduled tests run automatically at defined times, and run-to-run comparisons help you track performance trends over time. Exports in PDF, CSV, and JSON formats make it easy to share results with stakeholders or feed data into other tools.
Use Cases of LoadTester
Pre-Deployment Performance Gates
Before shipping a new release to production, engineering teams can run a scheduled load test against the staging environment with defined p95 latency and error rate thresholds. If the test breaches these thresholds, it auto-stops and sends an alert to Slack and email, preventing performance regressions from reaching end users. This use case ensures that every deploy meets baseline performance requirements and that capacity planning is data-driven.
Spike Testing for E-Commerce Checkout Flows
E-commerce platforms can create a spike test simulating high traffic during flash sales or holiday seasons. Using LoadTester, teams configure a test with 10,000 virtual users hitting the checkout endpoint at 5,000 requests per second, monitor live latency and error rates, and set auto-stop at p95 latency above 400ms. The live analytics reveal bottlenecks in real time, and the completed result provides a clear summary to share with stakeholders before major events.
API Regression Testing in CI/CD Pipelines
Development teams integrate LoadTester into their CI/CD pipeline to run a baseline performance test on every pull request. The test compares current results against the previous baseline, and if p95 latency increases by more than 15%, the pipeline fails and notifies the team via webhook. This automated regression detection catches performance degradation early in the development cycle, saving significant time and cost compared to finding issues in production.
Scheduled Nightly Baselines for Microservices
Platform teams schedule nightly load tests for critical microservices to track performance trends over time. Each test runs at 02:00 UTC with a fixed set of virtual users and duration, and results are automatically exported to CSV for long-term analysis. Run-to-run comparisons highlight gradual performance degradation, and alerts are triggered if any metric deviates significantly from the historical average, allowing proactive optimization before users notice any slowdown.
Pricing of LoadTester
LoadTester offers a free plan that allows you to start running tests immediately without any upfront commitment. For detailed pricing information on higher tiers, including limits on virtual users, requests per second, scheduled tests, and team collaboration features, please visit the LoadTester pricing page on the official website. Specific plan costs and feature comparisons are available there.
Frequently Asked Questions
How does LoadTester handle infrastructure and scaling?
LoadTester is a fully managed, cloud-native platform that handles all infrastructure scaling automatically. When you launch a test, workers are dispatched within three seconds and auto-scale based on your test configuration, whether you choose virtual users or requests per second mode. There is no infrastructure to provision, no servers to manage, and no worker orchestration required. The platform supports up to 10,000 virtual users and 10,000 requests per second in a single test, and the queue time is effectively zero.
Can I run load tests directly from my CI/CD pipeline?
Yes, LoadTester is designed for seamless CI/CD integration. You can trigger tests programmatically via the API, set up webhooks to receive results on completion, and configure pass/fail thresholds that determine pipeline success. Scheduled tests run automatically at defined times, and exports in PDF, CSV, and JSON formats allow you to feed results into your existing reporting tools. The platform also supports Slack and email alerts for instant notifications.
What metrics are available during and after a live test?
During a live test, LoadTester displays real-time metrics including requests per second (RPS), p50, p95, and p99 latency, active virtual users, and error counts. A latency distribution chart shows trends over the last 60 seconds. After the test completes, you receive a clean summary with total requests, average latency, p95 latency, data sent, data received, and success rate. Results are shareable via PDF, CSV, or JSON exports, and run-to-run comparisons are available for tracking performance over time.
How do thresholds and auto-stop work in LoadTester?
Thresholds are configurable guardrails that you set before or during a test. Common thresholds include p95 latency limits (e.g., p95 latency less than 400ms), error rate caps (e.g., error rate less than 2%), and regression alerts compared to previous baselines (e.g., notify Slack and email on a 15% increase). When a threshold is breached, LoadTester can automatically stop the test to prevent wasted resources, and it sends notifications via Slack, email, or webhook. This feature is essential for automated CI/CD pipelines.
You may also like:
Product Launch Checklist
A free launch checklist for SaaS, apps, AI tools and more. Every step says why it matters and when you can skip it.


Datamata Studios
Datamata Studios offers free developer utilities and premium market intelligence tools to empower your coding, career, and business decisions.
Boost Your Growth
Submit your SaaS to 140+ directories and SaaS submission sites. We handle every listing so you can focus on building your product.